Note that position changes may be due to cars dropping out, although I still haven't found a good way of representing this yet. I guess one approach would be to identify the number of cars that dropped out in each race that started ahead of each car for each race, but I'm not sure how to calculate that (yet....?!)
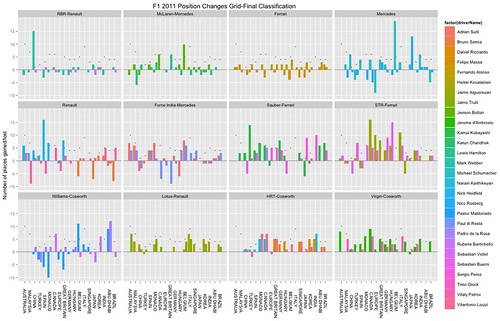
In the meantime, here's an augmented version of the above chart that identifies the number of cars that were not classified at the end of each race:
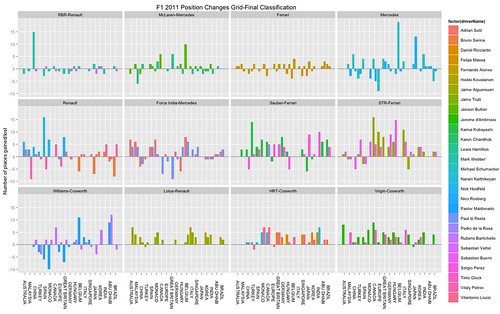
Here's another take on position change between grid and final position per driver:
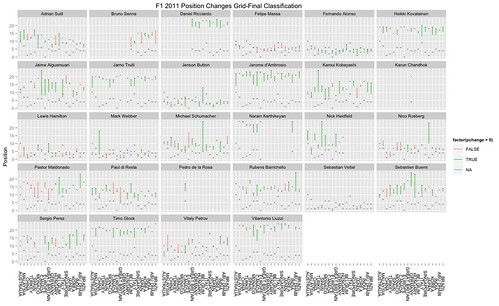
In this case, the line extends from grid position to final classification, and is coloured green for an improvement, red for a drop. The grey circle highlights the grid position, the grey + denotes the number of cars that were unclassified at the end of the race.
The R code used to generate the charts in this post from the raw data in a Google spreadsheet:
No comments:
Post a Comment
There seem to be a few issues with posting comments. I think you need to preview your comment before you can submit it... Any problems, send me a message on twitter: @psychemedia