If you want the data you can find it here (CSV)
A how to regarding using gnuplot to plot this sort of chart from a CSV data file can be found here: Plotting Tabular (CSV) Data and Algebraic Expressions On the Same Graph Using Gnuplot
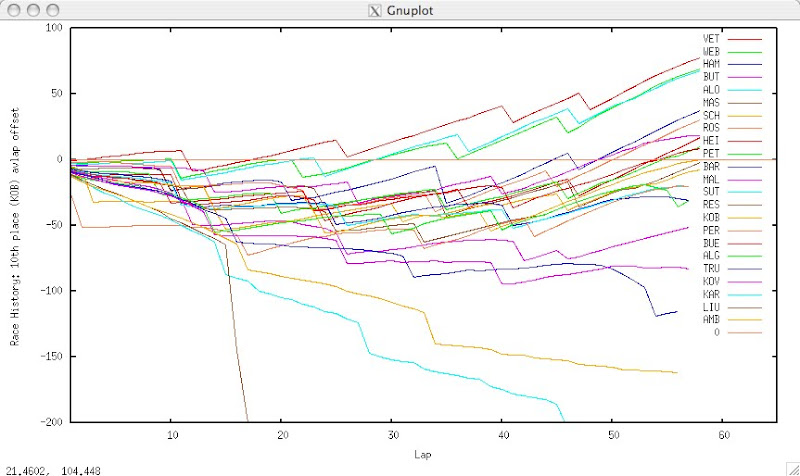
The following gnuplot command was used to generate the report, parameterised so that we can use an arbitrary fixed time as the offset/zero value:
gnuplot> set term x11
//My mac doesn't display anything with the aqua setting?
gnuplot> set datafile separator ","
//my data file is CSV, so define the separator, just in case...
gnuplot> set xrange [1:100]
gnuplot> set yrange [-200:100]
gnuplot> set xlabel lap
gnuplot> set ylabel "Race History: 10th place (KOB) avlap offset"
gnuplot> avlap=94.751
gnuplot> plot 'turdemoHistory.csv' using ($2==1 ? $1:1/0):($1*avlap-$3) with lines title "VET",'turdemoHistory.csv' using ($2==2 ? $1:1/0):($1*avlap-$3) with lines title "WEB",'turdemoHistory.csv' using ($2==3 ? $1:1/0):($1*avlap-$3) with lines title "HAM",'turdemoHistory.csv' using ($2==4 ? $1:1/0):($1*avlap-$3) with lines title "BUT",'turdemoHistory.csv' using ($2==5 ? $1:1/0):($1*avlap-$3) with lines title "ALO",'turdemoHistory.csv' using ($2==6 ? $1:1/0):($1*avlap-$3) with lines title "MAS",'turdemoHistory.csv' using ($2==7 ? $1:1/0):($1*avlap-$3) with lines title "SCH",'turdemoHistory.csv' using ($2==8 ? $1:1/0):($1*avlap-$3) with lines title "ROS",'turdemoHistory.csv' using ($2==9 ? $1:1/0):($1*avlap-$3) with lines title "HEI",'turdemoHistory.csv' using ($2==10 ? $1:1/0):($1*avlap-$3) with lines title "PET",'turdemoHistory.csv' using ($2==11 ? $1:1/0):($1*avlap-$3) with lines title "BAR",'turdemoHistory.csv' using ($2==12 ? $1:1/0):($1*avlap-$3) with lines title "MAL",'turdemoHistory.csv' using ($2==14 ? $1:1/0):($1*avlap-$3) with lines title "SUT",'turdemoHistory.csv' using ($2==15 ? $1:1/0):($1*avlap-$3) with lines title "RES",'turdemoHistory.csv' using ($2==16 ? $1:1/0):($1*avlap-$3) with lines title "KOB",'turdemoHistory.csv' using ($2==17 ? $1:1/0):($1*avlap-$3) with lines title "PER",'turdemoHistory.csv' using ($2==18 ? $1:1/0):($1*avlap-$3) with lines title "BUE",'turdemoHistory.csv' using ($2==19 ? $1:1/0):($1*avlap-$3) with lines title "ALG",'turdemoHistory.csv' using ($2==20 ? $1:1/0):($1*avlap-$3) with lines title "TRU",'turdemoHistory.csv' using ($2==21 ? $1:1/0):($1*avlap-$3) with lines title "KOV",'turdemoHistory.csv' using ($2==22 ? $1:1/0):($1*avlap-$3) with lines title "KAR",'turdemoHistory.csv' using ($2==23 ? $1:1/0):($1*avlap-$3) with lines title "LIU",'turdemoHistory.csv' using ($2==25 ? $1:1/0):($1*avlap-$3) with lines title "AMB",0
(There may be a more efficient way of writng this? If you know of one, please let me know in the comments...:-)
To display the chart for other average lap times using the avlap parameter, here they are:
1 93.406
2 93.558
3 94.1
4 94.431
5 93.58
6 94.782
7 94.879
8 94.226
9 94.455
10 94.581
11 95.289
12 95.652
14 95.104
15 95.706
16 94.751
17 95.105
18 94.603
19 95.291
20 96.81
21 96.208
22 98.668
23 102.357
25 97.638
If you come up with any other variants on this chart that seem useful from a "what happened?" point of view, please let me know in the comments.
PS as well as the elapsed time data by car per lap, the linked to data file also includes time to leader data for you to play with:-)
All timing data © 2011 Formula One World Championship Ltd, 6 Princes Gate, London, SW7 1QJ, England.
No comments:
Post a Comment
There seem to be a few issues with posting comments. I think you need to preview your comment before you can submit it... Any problems, send me a message on twitter: @psychemedia