So here's a first attempt looking at some of the fuel corrected laptimes over some long practice stints for one or two of the drivers. (Timing data available here. Fuel time correction data obtained from AT&TWIlliams: Spanish GP Preview.)
To start with, let's look at Mark Webber (WEB). Here's how Red Bull made use of the practice sessions - the time along the bottom is the elapsed time of the particular session in seconds starting from the first mark on the timing sheet by any driver. The colours denote practice session (first, second or third free practice) and the symbols identify different stints. I've oopsed badly on the labelling of the y-axis: it's actually fuel corrected laptimes (about fuel corrected laptimes):
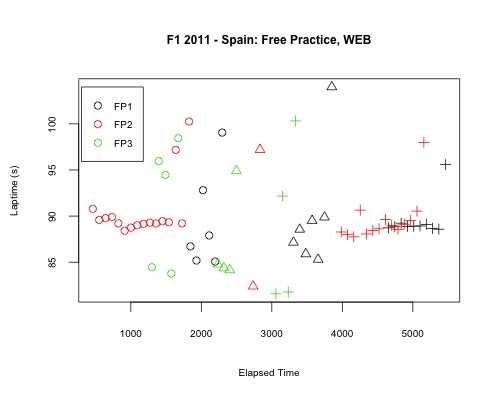
We see the long stint, red FP2 times do appear to be showing a drop off in time (remember, these are fuel weight penalty adjusted times) over each stint.
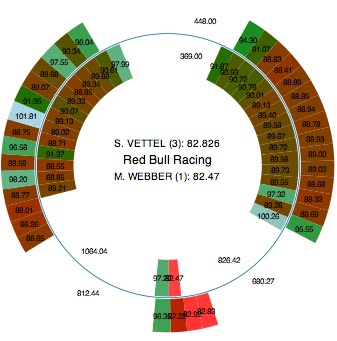
So you can get a feel for reading the chart, here's Red Bull's session utilisation chart for free practice 2 (WEB's laps are inside the circle); the chart is read like an elapsed time clock across the session.
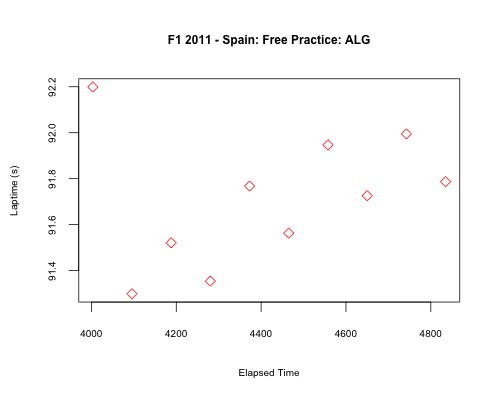
Looking at other session utilisation charts, I noticed that Alguesuari seemed to have a long FP2 stint, so let's look at his times:
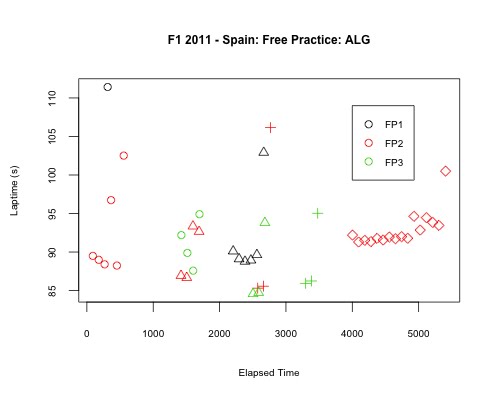
After an initial coming of of the tyres (maybe?) at the start of the long stint at the end of FP2, do the tyres hang on pretty well (with maybe only a slight fade) before the raggedy times at the end of the stint?
Let's take a closer look:
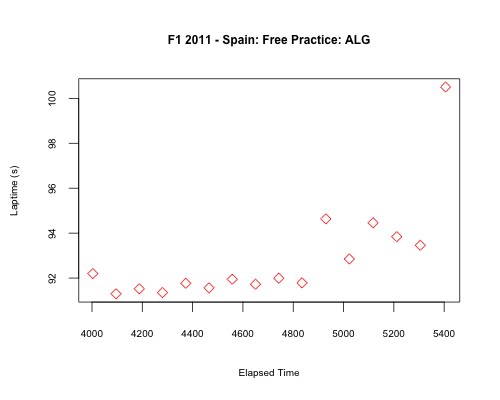
At this scale, we might say the fade isn't that much. But closer up?
A definite drop off - on the order of a tenth of a second per lap. But there seems to be structure in those times two - so have I made a systematic error in my fuel adjustment calculations, or was ALG doing an on/off, this way/that way trial of some sort over those few laps?
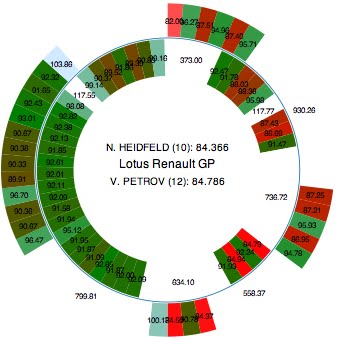
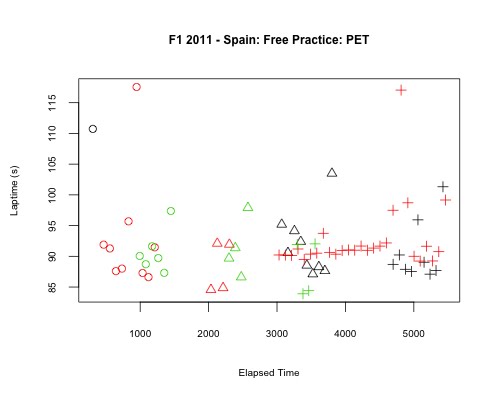
Looking at Renault's FP2 session utiisation chart, Petrov's times are interesting, Towards the end of the session, did he maybe try a pitstop?
Here are his laptimes over all three sessions:
And here's a close-up on the long stint at the end of FP2:
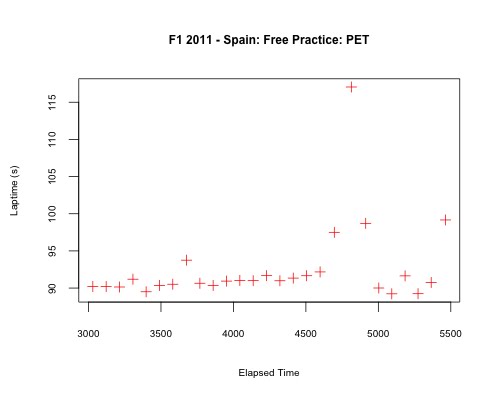
Do the tyres start to go off around 4200s? (Remember, the fuel weight adjustment is approximate...) Do we see a pitstop around 4750s and resulting improvement in laptime from a fresh pair of tyres around the 5000s elapsed time mark?
Commands for generating the scatterplots (R-Studio) - of the form:
t='F1 2011 - Spain: Free Practice: KOV'
dnum='20'
plot(Fuel.Corrected.Laptime ~ Elapsed,data=subset(esp_2011practicelaptimes,DriverNum==dnum ),pch=Stint,col=Session, main=t,xlab="Elapsed Time",ylab="Fuel Corrected Laptime (s)")
legend(4000,109,c("FP1","FP2","FP3"),col=1:3,pch=1:1:1)
PS here's another view - long stint times across all drivers/all sessions:
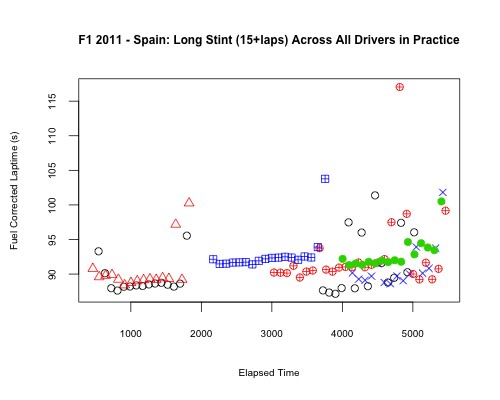
No comments:
Post a Comment
There seem to be a few issues with posting comments. I think you need to preview your comment before you can submit it... Any problems, send me a message on twitter: @psychemedia